04.07.2021
These are:
- Visual branch structure;
- Adding different icons;
- Inserting images;
- Drawing own icons.
Yes, IOctopus now has all three of these features.

You can load images from your computer into the mind maps for idea visualization. At the branches they will be displayed small but nice. When you click, they will expand to the full screen with a lightbox.
How to add a picture?
The easiest way to add an image is to simply drag it to the branch or the center.
But there is a second option - using the icons menu.

To replace with another - just load or drag another image.
Delete - right click on the picture.

How can you visualise your thoughts even faster, easier and more relevant?
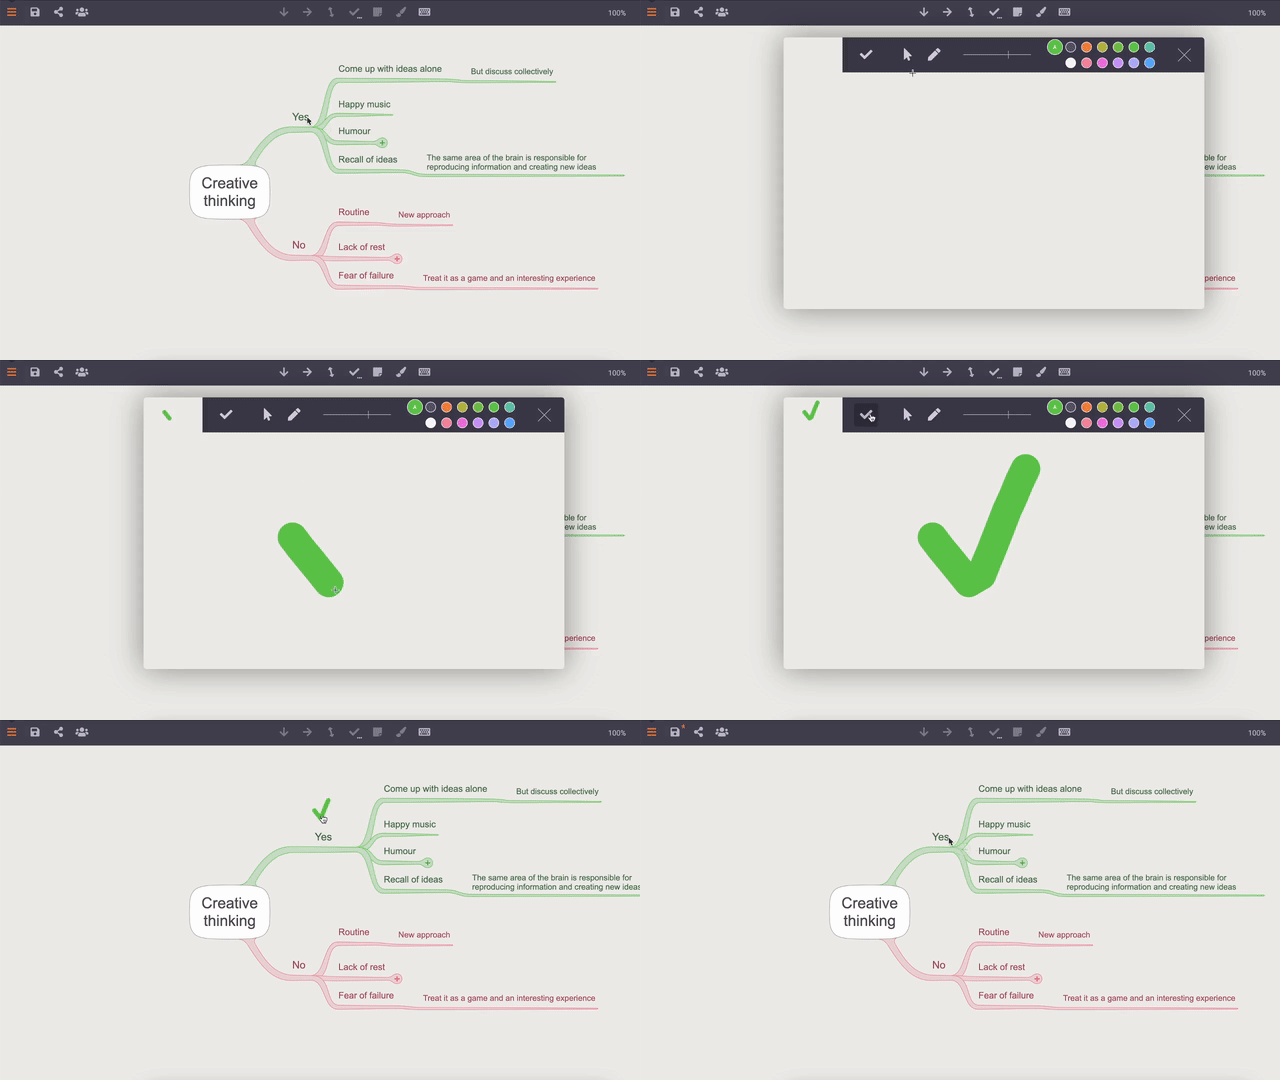
Try drawing the icon yourself. This feature is released on 4 March 2022.

That's all, try it yourself in your map, before you forget how to do it 🙂
See also
How to master all the key nuances of creating mind maps in 10 minutes? And most importantly, to master for years. So that you don't have to go back to it.
It's easy with the quick, interactive assignments in this article.
How to make nice presentations even when you're not a designer?
Because a presentation is a way to present information clearly and convey your ideas to the audience. About a product, a service, a company. For explaining a process. For science or business. In any case, it is important that it was simple, beautiful and visual. The success of the presentation depends on it.
